The moving average crossover is a popular technical indicator used by traders to identify changes in the security trend. By analyzing when a short-term moving average crosses above or below a longer-term moving average, traders can gain insight into establishing positions aligned with the prevailing market trend.
In this article, we will provide an in-depth explanation of how moving average crossovers work, how to optimize their parameters, and strategies for incorporating them into a trading system. We’ll look at examples of crossovers in action and discuss how to confirm signals with additional technical analysis. By the end, readers will have a clear understanding of this powerful trend-following concept.
What is a Moving Average?
A moving average (MA) is a calculation that provides a smoothed representation of price data over a selected period. To generate a simple moving average, you sum the closing price of an asset over the period and divide it by the number of periods.
For example, a 20-day simple moving average of Microsoft stock would take the sum of the last 20 closing prices and divide by 20. This smooths out short-term volatility and filters noise from the price data. Longer moving averages respond more slowly to price changes compared to shorter periods.
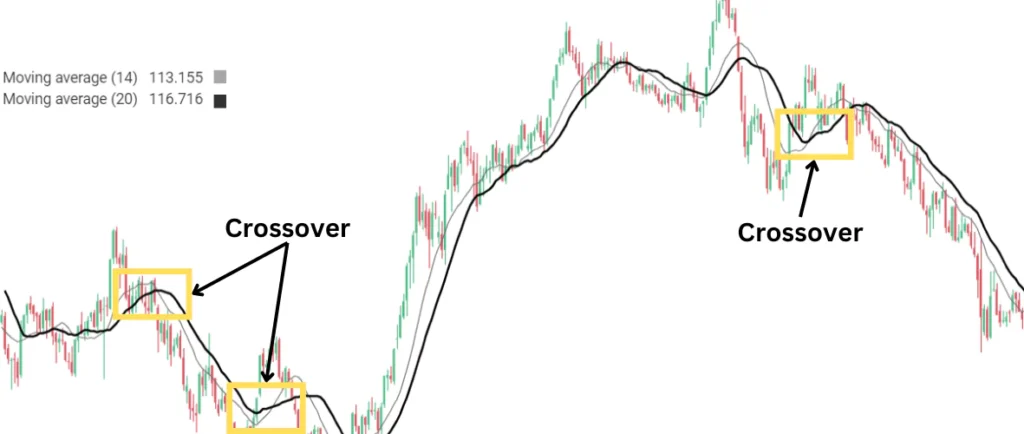
Plotting multiple moving averages on a chart allows traders to identify crossovers as indicators of potential trend changes. When a shorter period average crosses above a longer one, it signifies momentum may be shifting in an upward direction.

Optimizing Moving Averages
To use moving average crossovers effectively, parameters like period length must be optimized for the asset and timeframe. Popular combinations include the 50-day and 200-day SMA on daily charts for major trends. Shorter periods work on intraday timeframes.
Traders can backtest different moving average combinations over historical data to evaluate performance. They may find some work better than others depending on factors like average daily trading range. Parameters also require ongoing review, as market regimes and volatility profiles change.
Golden and Death Crossovers
The most commonly referenced moving average crossovers are the golden crossover and death crossover. A golden crossover occurs when the short-term moving average rises above the long-term average, indicating an emerging bullish trend. Conversely, a death crossover is bearish, with the short-term average falling below the longer one.
These signals seek to capture major shifts after consolidations or corrections and align positions with the prevailing direction of higher prices (golden crossover) or lower prices (death crossover). Traders watch for confirmation before entering trades in the direction of the crossover.
Confirming the Signal
It’s important not to take signals in isolation but instead seek confirmation. Price action should show signs of following through in the expected direction, such as breaking out of consolidation patterns. Additional confirmation can come from momentum oscillators like the RSI diverging from oversold/overbought levels.
Traders may also look for changing behavior in volume around crossover points, with increasing amounts accompanying directional moves more likely to persist. Using moving average crossovers as part of a confluence-based system reduces the chances of whipsaws against position entries.
Strategies for Trading Moving Average Crossovers

Once a valid moving average crossover is confirmed, traders can enter trades. Profits are targeted at technical resistance/support levels, while protective stops guard the downside. Crossovers naturally align positioning with trends and can be focused on either:
- Swing trading – Entries using daily/4hr charts to capture mid-term trend moves
- Day trading – Entries from hourly/30-minute charts to profit from intraday momentum shifts
- Scalping – Very short-term trades on 5min charts or less during periods of high volatility
Trailing stops help let profits run after successful moves develop following crossovers. Having defined rules prevents emotional reactions to fluctuations.
Incorporating Additional Checks
Combining moving average crossovers with other technical concepts can result in robust strategies. For example:
- Requiring crossovers happen after retracement pullbacks to key moving averages or Fibonacci levels for entries.
- Using Average True Range (ATR) bands to define low-volatility entry periods after signals form.
- Including momentum indicators with bullish/bearish divergences from crossovers as part of a system backtest.
- Cross-checking signals against Elliot wave counts, Ichimoku, or other tools traders favor for extra confluence.
Over time, experience fine-tunes the individual approach while sticking to a systematic process.
Practical Examples of Moving Average Crossovers
Seeing moving average crossovers in action provides valuable context. Below are annotated charts of two recent examples exhibiting:
- A bullish golden crossover on the daily Tesla chart in October 2020 around the $380 level. This led to a multi-month uptrend into early 2021.
- A bearish death crossover on the weekly Bitcoin chart in December 2017 preceded a steep correction into the following year’s lows.
These real-world instances demonstrate how crossovers work to identify shifts after periods of consolidation or tight ranges. Contexts like volume profiles and other analyses provide confirmation potential.
Conclusion | Moving Average Crossover
In summary, the moving average crossover is a straightforward yet powerful technical tool that allows traders to systematically align themselves with prevailing market trends. Whether used as a stand-alone strategy or combined with additional indicators, implementation requires defined rules, confirmation techniques, and ongoing optimization based on historical testing. When applied correctly, crossovers provide reliable insights into changing market dynamics.


