The relative strength index (RSI indicator) is one of the most popular technical indicators used by traders to identify momentum shifts and spot potential market reversals. By comparing the magnitude of recent price gains to recent losses, the RSI generates overbought and oversold readings that can provide valuable buy and sell signals when trading currencies.
In this comprehensive guide, we will explain what the RSI indicator is, how to read and interpret the various elements of the indicator, tips for effective usage, and several strategies for incorporating it into your Forex analysis. By understanding how to properly use the RSI, it can become a powerful tool in your technical trading arsenal.
What is the RSI Indicator?
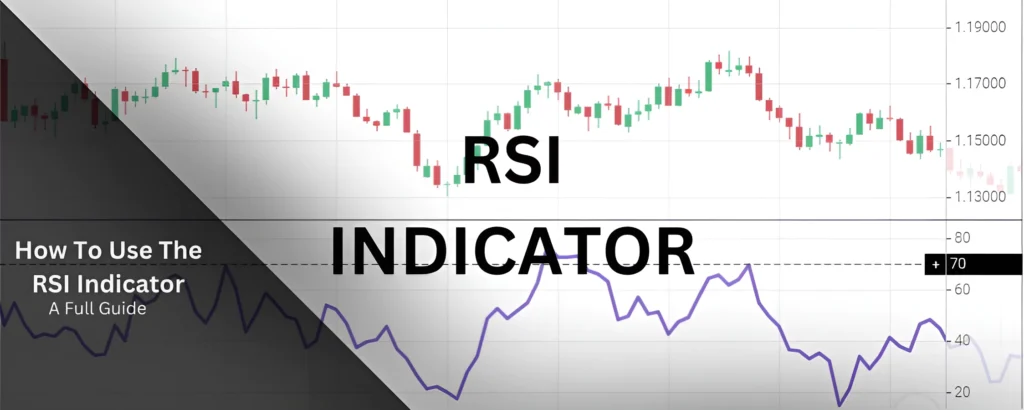
The RSI is a momentum oscillator that measures the speed and change of price movements to evaluate overbought or oversold conditions in the market. It was developed by noted technical analyst J. Welles Wilder and was introduced in his 1978 book ‘New Concepts in Technical Trading Systems.’
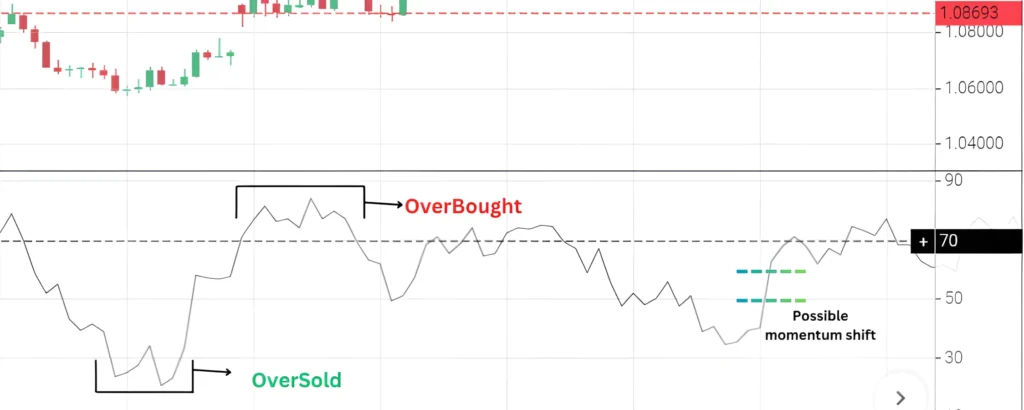
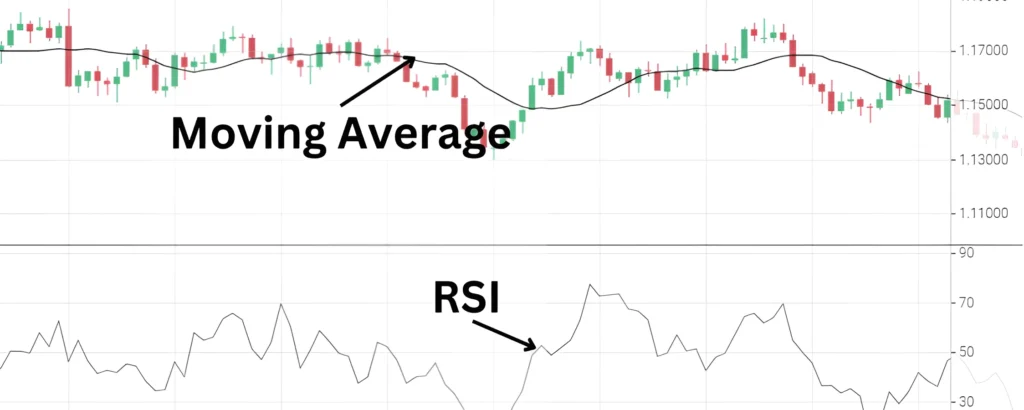
The indicator uses a 14-period RSI calculation by default, which considers price data over the past 14 periods. It generates an output number that oscillates between 0 and 100. Readings above 70 are considered in overbought territory, indicating prices may be rising too fast and could be due for a pullback or trend reversal. Readings below 30 signal oversold conditions, meaning prices could be falling too quickly and are likely to recover higher.
How do you Read an RSI Indicator?
There are several key aspects traders watch for when analyzing the RSI:
Divergence – When the RSI forms a new high/low that is not confirmed by a corresponding new high/low in price. This can signal an impending trend change or consolidation.
Overbought/Oversold Levels – Watch for movements above 70 and below 30, as well as pullbacks away from these thresholds.
Peaks & Troughs – Higher highs/lower lows show upward momentum, while lower highs/higher lows signal downward momentum.
Time Spent in Zones – The longer above 70 or below 30, the stronger the trend. Short amounts of time suggest less strength.
Crossing the 50 Level – Just like crosses of moving averages, crossing above or below 50 could show possible momentum shifts.
How to Use the RSI Effectively
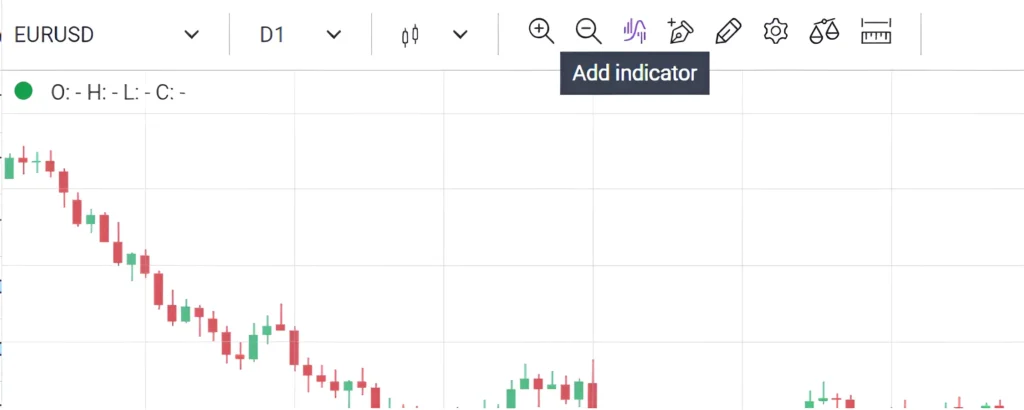
On the Allpips Trading platform indicators can be easily added with the “add indicator” button found on the top of the screen. To add the RSI indicator just click on add indicators and choose RSI and it will automatically be added to your trading chart. The width and color of the RSI indicator can be changed with the “edit objects” button that has a pencil icon.
It’s generally best to combine the RSI with other technical indicators to gain a more complete picture of the market. Looking for divergences between the RSI and price action can be an effective strategy for spotting potential reversals. The RSI will form new highs or lows without confirmation from the price, signaling a trend change may be imminent.
Traders also use the overbought and oversold levels of the RSI to identify appealing entry and exit points. Waiting for the indicator to dip below 30 or rise above 70 before initiating a trade helps filter out whipsaws.
It’s best to watch for momentum shifts at peaks and troughs of the RSI for new opportunities as well. Paying attention to how long the indicator spends within the overbought or oversold zones is also an important context before entering positions.
Crossing above or below the 50 level on the RSI can help confirm changes in trend direction or breaks of support and resistance levels. Incorporating moving averages into the strategy, such as looking to buy on bounces off a rising 30-period MA, adds another layer of confirmation.
Why the RSI Indicator is Important
The RSI helps filter out price noise by clearly illustrating momentum swings not easily visible without it. Some key benefits include:
– Identifies high-probability trade setups by signaling overextended and potentially reversing markets.
– Removes emotions from trading decisions and allows a systematic approach.
– Works effectively across all time frames from short-term to long-term analysis.
– Provides an early warning for traders to exit positions before large drawdowns or to enter in the direction of new momentum.
– Easy-to-read oscillator helps confirm trends and support/resistance breaks more clearly.
RSI Strategies
With the RSI, there are several strategies traders commonly employ:
Divergence Trading
Divergence trading involves looking for instances where the RSI forms a new high or low without confirmation from the price action. This signals a divergence and potential trend change. Traders will take positions counter to the divergence, expecting the trend to reverse before it happens.
Overbought/Oversold Bounces
With this strategy, traders watch for when the RSI dips below 30 or rises above 70, indicating an oversold or overbought level. These extremes suggest a bounce may occur as the price reverts back toward the mean. Positions are entered aiming to profit from the typical bounce in the direction of the trend.
Momentum Swing Trades
This strategy focuses on capturing large momentum moves. Traders look for clear shifts in momentum at peaks and troughs in the RSI. Positions are entered in the direction of the new momentum, hoping to ride the move higher or lower.
Trend Following
Trend following only involves trading in the direction of the prevailing trend. Traders use the RSI together with moving averages to determine the trend direction. Positions are then only taken that are following the identified trend.
Slow Stochastic RSI
Some traders add a slower stochastic oscillator to their RSI chart. This generates crossover signals when the stochastic lines cross above or below specific levels, like 80 and 20. These crossovers confirm reversal opportunities on the main RSI.
Conclusion
In summary, the RSI is a versatile technical indicator that every trader should become familiar with. When incorporated properly into analysis, it provides an objective measure of market momentum useful for filtering out the noise, finding high-probability trade setups, and helping decide optimum entry and exit points. With ongoing practice and refinement of strategies, the RSI can become a consistently valuable tool in making effective Forex trading decisions.

