
Are you looking to take your trading game to the next level by implementing a strategy that has proven successful? In this article, we’ll break down a technique that combines the Bollinger Band and RSI indicators to identify high-probability setups for entry and exit. By following a simple, rules-based process using these well-established tools, you can start earning strong and steady gains.
We’ll explain step-by-step how this strategy works, including definitions of the key indicators. Then, detailed guidelines will outline the signals to watch for and the specific actions you should take at each point.
What are Bollinger Bands and RSI?
Let’s first familiarize ourselves with the core concepts that power this strategy. Bollinger Bands are volatility bands placed above and below a moving average. They adjust to price action, expanding during high volatility and contracting in quiet markets. When the price touches the upper or lower band, it is considered an extremum and signals a potential reversal.
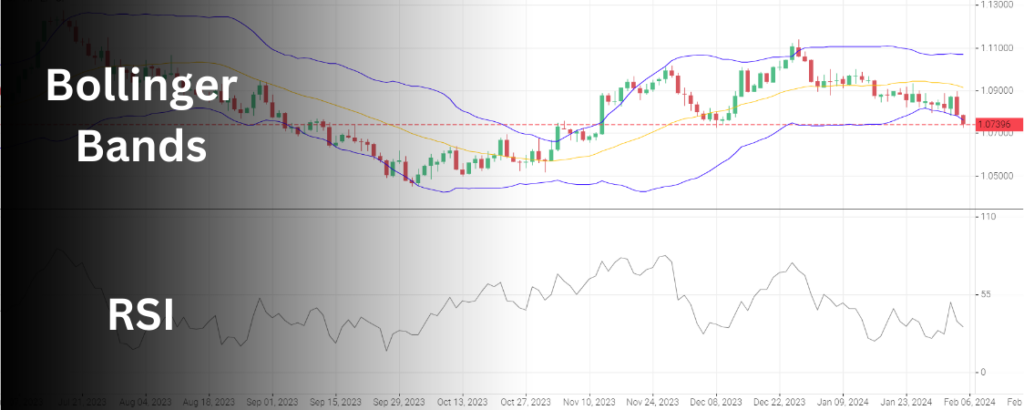
The Relative Strength Index (RSI) is an oscillator that measures momentum on a scale of 0-100. It indicates overbought or oversold conditions based on where it lies in this range. Readings above 70 suggest the asset is overbought, while under 30 means it’s oversold. Reversions from these extremes are common.
How to Setup Your Trading Chart
As mentioned for this strategy we will be using two indicators. First, let’s add the Bollinger bands from the “add indicator” button. For the Bollinger bands to be ready to use we must change the period to 20, and the colors of the bands and background can be changed to your preference.
Our second indicator is the RSI and it can be added in the same manner. After our RSI is added we have to change the period to 13
The Bollinger Bands and RSI Trading Strategy
The main idea of this strategy is to enter long positions (Buy) when the RSI is below 30 and the price touches the lower Bollinger Band. Both these conditions need to happen, as with just one you might get a false signal. We then sell our position when the price goes back to the middle line (the average).
Secondly, if the price touches the upper band with the RSI also surpassing 70, then we go short (Sell). We close our position just like before when we reach the middle line.
An Example Using This Strategy
Let’s visualize how this may play out on a real chart. On the daily chart of Tesla stock from late 2021, RSI fell below 30 on December 20th. The next day, as the price dipped just below the lower Bollinger Band, we could have entered a long trade.
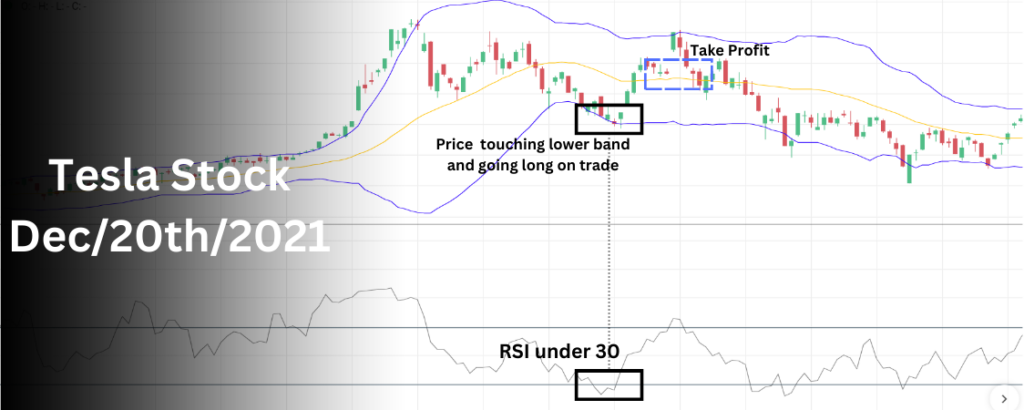
Placing the stop loss as suggested, the position would not have been hit. Within a week, the RSI crossed 30 to the upside while Tesla regained its bands – signaling to Take Profits.
When to Avoid This Strategy
As we have seen this strategy is easy to learn and use. However, there are certain market conditions in which you should not trade. If the market is trending sideways
There are two things that can help us identify this before it even happens. First, we can notice that the bands are thin and close together. The second major thing we can notice is the RSI staying between 30 and 70 without passing any. However when the market is trending sideways and suddenly breaks into a direction, it usually heads in that direction with huge momentum. When this happens you should not trade right away until the movement returns to normal.
Conclusion | Bollinger Bands and RSI Trading Strategy
Combining the Bollinger Bands indicator with the Relative Strength Index (RSI) carries the benefits of both momentum and volatility signals. Bollinger Bands capture volatility by showing when prices reach overextended levels. Simultaneously, RSI measures underlying momentum, revealing overbought or oversold conditions.
By following guidelines like looking for long entries when RSI reaches 30 and the price touches the lower band, guesswork is removed. This highlights high-probability setups clearly defined by two proven tools. Taking profits as RSI rises back above 30 adds discipline.
By employing this method consistently over a variety of assets and periods, returns can be produced by the probability present in the indicators. Backtesting shows steady, reliable results from identifying statistically advantageous entry points. For traders seeking an effective, systematic method, giving this strategy a serious try could dramatically improve outcomes through quantitative market readings. With odds stacked positively, trading results may never be the same.
Disclaimer
This article is for informational and educational purposes only. It is not intended as investment advice. All trades and investments involve risk, including the potential loss of capital. Please conduct your due diligence and research before making any trading or investment decisions.