When it comes to Forex trading, the MACD (Moving Average Convergence Divergence) is one of the most popular tools in a trader’s arsenal. But here’s the thing—using it alone might not always give you the full picture. That’s where combining MACD indicator with other technical indicators comes into play. Think of it like assembling an all-star team where each member brings something unique to the table.
By combining the MACD with tools like RSI, Bollinger Bands, or moving averages, you can create a more robust trading strategy that increases your chances of success. In this guide, we’ll dive into the essentials of combining MACD with technical indicators, how it works, and how you can use it to fine-tune your Forex trading skills.
What is the MACD and Why Use It?
Before we get into the nitty-gritty of combining MACD with other indicators, let’s quickly recap what the MACD is all about. The MACD (Moving Average Convergence Divergence) is a trend-following momentum indicator that helps traders identify potential market reversals and momentum shifts.
Key Components of MACD:
- MACD Line: The difference between two moving averages (usually 12-period and 26-period EMAs).
- Signal Line: A 9-period EMA of the MACD line.
- Histogram: A visual representation of the difference between the MACD line and the Signal Line.
Simply put, the MACD tells you whether bulls or bears are in control and when momentum might be shifting. But combining it with other indicators can help you confirm signals and reduce the risk of false ones.
Why Combine MACD With Other Technical Indicators?
Using the MACD alone can sometimes generate false signals, especially in choppy or range-bound markets. That’s why traders often pair it with additional tools to create a more well-rounded strategy. Here are some key benefits of combining MACD with technical indicators:
- Enhanced Accuracy: Confirm signals and reduce noise.
- Identify Overbought/Oversold Levels: Combine the MACD with tools like RSI for better timing.
- Adapt to Market Conditions: Different indicators complement each other in trends, ranges, or volatile markets.
- Improved Risk Management: Gain a clearer picture of when to enter and exit trades.
Now that we’ve covered the “why,” let’s jump into the “how.”
1. Combining MACD With RSI
What is RSI?
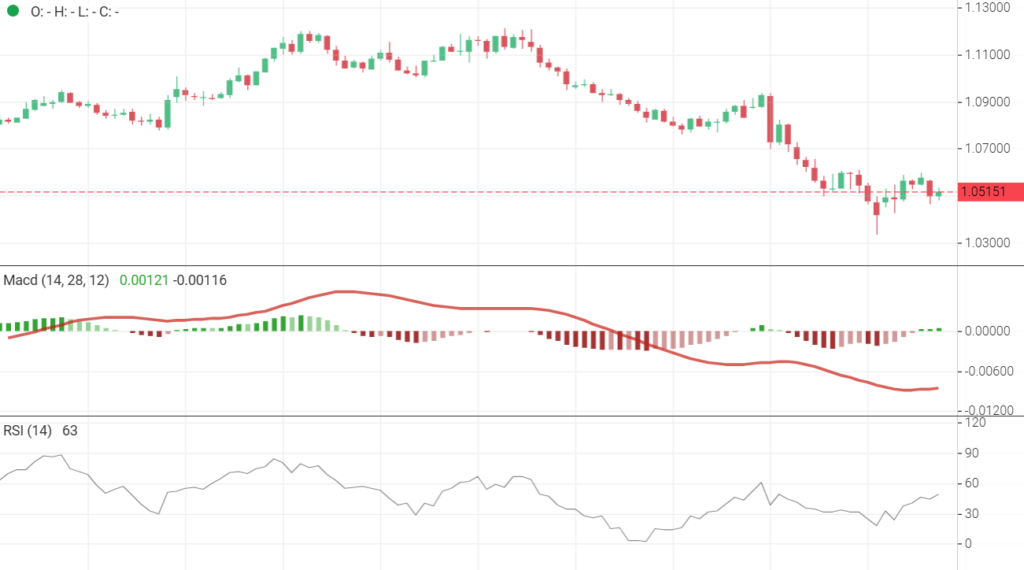
The Relative Strength Index (RSI) is a momentum oscillator that measures the speed and change of price movements. It ranges from 0 to 100 and identifies overbought (above 70) and oversold (below 30) conditions.
How They Work Together:
While MACD focuses on momentum and trend direction, RSI helps identify whether a price is overbought or oversold. This makes them a powerful duo.
Trading Strategy:
- Look for a buy signal when the MACD shows bullish momentum (MACD line crosses above the Signal line) while the RSI is below 30 (oversold).
- Look for a sell signal when the MACD shows bearish momentum (MACD line crosses below the Signal line) while RSI is above 70 (overbought).
Why This Combo Works:
MACD gives the trend direction, while RSI confirms whether the trend is sustainable. Together, they can help you avoid jumping into trades too early.
2. Combining MACD With Bollinger Bands
What are Bollinger Bands?
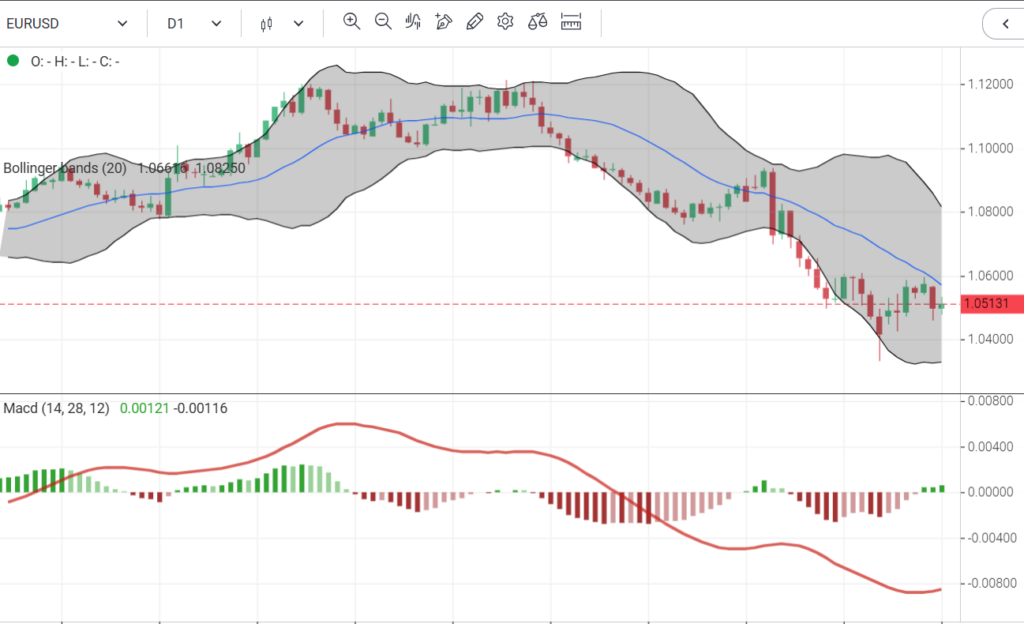
Bollinger Bands measure price volatility and consist of three lines:
- A middle line (simple moving average).
- An upper band (2 standard deviations above the SMA).
- A lower band (2 standard deviations below the SMA).
How They Work Together:
While Bollinger Bands highlight volatility and potential price reversals, the MACD helps confirm the momentum behind those moves.
Trading Strategy:
- Buy Setup: When the price touches or breaks below the lower Bollinger Band and the MACD shows a bullish crossover (MACD line crosses above the Signal line).
- Sell Setup: When the price touches or breaks above the upper Bollinger Band and the MACD shows a bearish crossover.
Why This Combo Works:
Bollinger Bands highlight extremes in price movement, and MACD confirms whether the momentum supports a reversal or continuation.
3. Combining MACD With Moving Averages
What is a Moving Average?
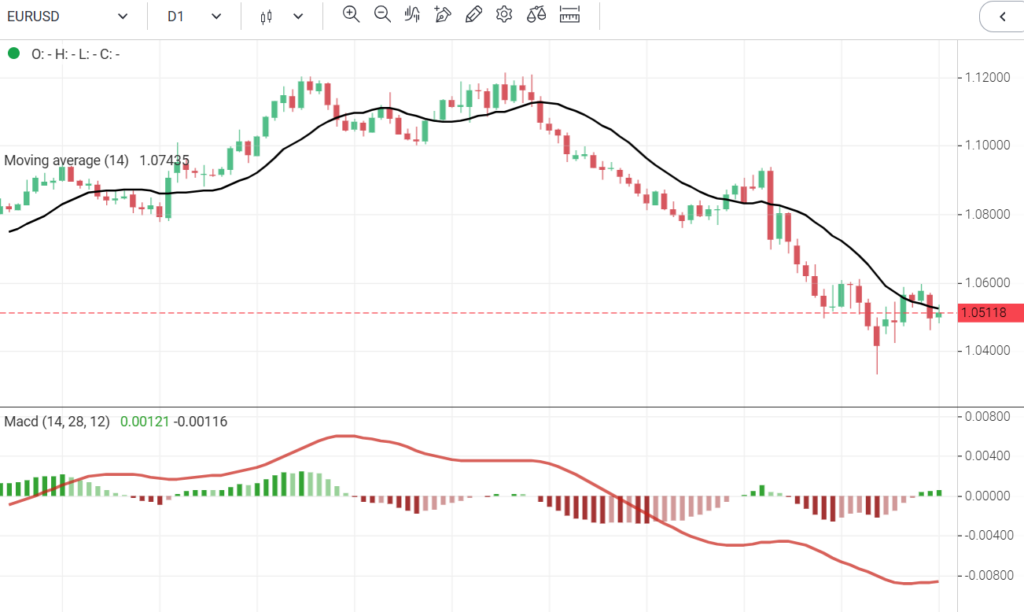
A moving average smooths out price data to help identify the overall trend. The most common types are the simple moving average (SMA) and the exponential moving average (EMA).
How They Work Together:
While MACD measures momentum, a moving average helps you identify the overall market trend. This combination ensures you trade in the direction of the trend.
Trading Strategy:
- Look for buy opportunities when the MACD is bullish and the price is above the 50-day SMA or EMA.
- Look for sell opportunities when the MACD is bearish and the price is below the 50-day SMA or EMA.
Why This Combo Works:
Moving averages act as dynamic support/resistance levels, while MACD confirms the strength of the trend.
4. Combining MACD With the Alligator Indicator
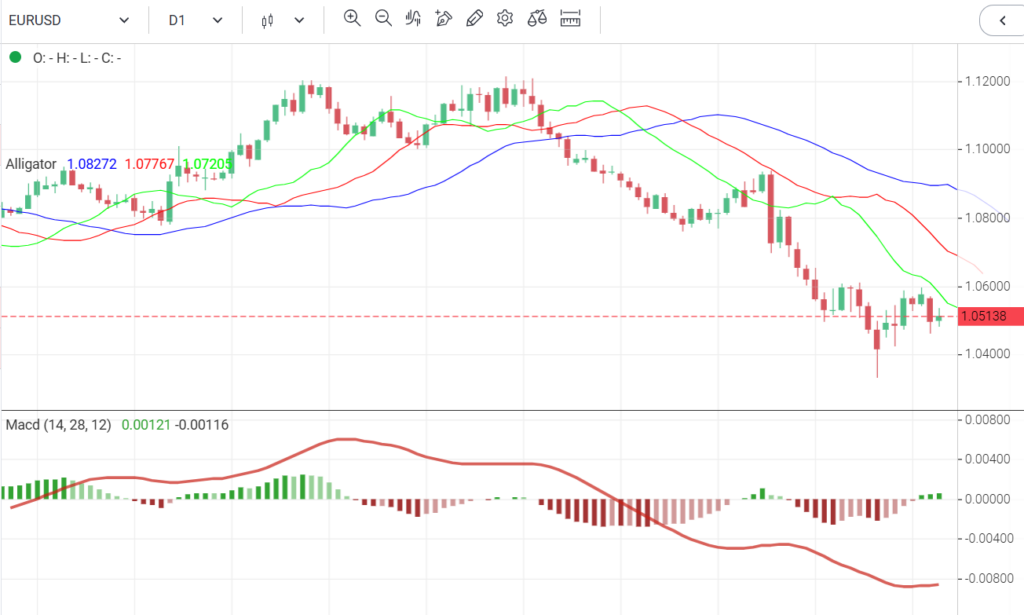
What is the Alligator Indicator?
The Alligator Indicator consists of three moving averages (jaw, teeth, and lips) that help identify trends and periods of consolidation.
How They Work Together:
The Alligator Indicator identifies when the market is trending or ranging, while the MACD confirms momentum within those trends.
Trading Strategy:
- Buy Signal: When the Alligator’s “lips” cross above the “teeth” and the MACD shows a bullish crossover.
- Sell Signal: When the Alligator’s “lips” cross below the “teeth” and the MACD shows a bearish crossover.
Why This Combo Works:
The Alligator gives you a clear picture of the trend, while MACD ensures you’re trading with the momentum.
5. Combining MACD With the Smooth Moving Average
What is the Smooth Moving Average (SMMA)?
The SMMA is a slower moving average that gives more weight to recent data while smoothing out older price data.
How They Work Together:
The SMMA helps identify long-term trends, while the MACD pinpoints shorter-term momentum shifts.
Trading Strategy:
- Look for buy setups when the MACD is bullish and the price remains above the SMMA.
- Look for sell setups when the MACD is bearish and the price remains below the SMMA.
Why This Combo Works:
The SMMA helps filter out noise, allowing you to focus on significant market trends and MACD momentum.
Tips for Successfully Combining MACD With Technical Indicators
Combining MACD with technical indicators can be powerful, but it’s not foolproof. Here are some tips to maximize your success:
- Don’t Overload Your Chart: Stick to 1-2 additional indicators alongside the MACD. Too many can lead to confusion and “paralysis by analysis.”
- Test Your Strategy: Use a demo account to test your combined strategy before risking real money.
- Focus on Confluence: Look for multiple indicators confirming the same signal. This reduces the risk of false signals.
- Adapt to Market Conditions: Some combinations work better in trends, while others shine in range-bound markets.
- Use Stop Losses and Take Profits: No strategy is perfect. Always protect your trades with proper risk management.
Conclusion
Combining MACD with technical indicators is like putting together a puzzle—each piece adds clarity to the bigger picture. Whether it’s using RSI to spot overbought/oversold conditions, Bollinger Bands to gauge volatility, or moving averages to follow the trend, these combinations can take your Forex trading to the next level.
But remember, no strategy is foolproof. Combining indicators is about improving your odds, not guaranteeing success. Always practice, test, and refine your MACD strategies before diving into live trading. With patience and discipline, you’ll be well on your way to mastering the art of Forex trading.
FAQs
1. What makes MACD unique compared to other indicators?
The MACD is versatile—it combines trend-following and momentum analysis into one tool, making it a favorite among traders.
2. Can I use more than two indicators with MACD?
Yes, but it’s best to keep your setup simple. Too many indicators can lead to conflicting signals and analysis paralysis.
3. Which timeframes work best for combining MACD with indicators?
The best timeframe depends on your trading style. For day trading, use shorter timeframes (5-minute, 15-minute). For swing trading, stick to higher timeframes (4-hour, daily).
4. Is MACD effective for all market conditions?
MACD works best in trending markets. In range-bound or sideways markets, combining it with Bollinger Bands or RSI can improve its effectiveness.
5. How do I avoid false signals when combining MACD with indicators?
Look for confluence—multiple indicators pointing to the same conclusion. Always confirm signals with price action or support/resistance levels.

