Price action refers to the activity produced by buyers and sellers in the market and how it influences currency prices over time. By analyzing candlestick charts and overall price behavior, price action traders can identify patterns and clues to predict future market movement without relying on technical indicators. This strategy focuses purely on what the “real money” in the market is doing through prices.
Price action trading strategies offer various benefits for forex traders. It removes indicator lag time and repainting issues, relying only on prices that have physically occurred. It also functions across all timeframes from daily to 5-minute charts universally. With practice, traders can gain an intuitive feel for the psychology behind price action and market flows.
This article will outline the basic tools and techniques used in a successful price action approach, including identifying common chart patterns and candlestick formations, using support/resistance levels, applying strategic order entry methods, and smart money management. Let’s get started with the core components.
Core Concepts of Price Action Trading section
Candlestick Formations
The shape of candlesticks conveys important information about supply and demand through their real bodies and wicks. Certain patterns like pin bars, doji candles, and hammer candles can foreshadow potential reversals based on how buyers and sellers interact within a given period.
Support and Resistance
Areas on the chart where price has repeatedly paused or changed direction in the past act as invisible “ceilings” and “floors” for price movement. Breakouts above resistance or below support often indicate a change in market momentum.
Trendlines
Connecting significant highs and lows on the chart allows traders to identify the overall direction of the trend. Breaks of uptrend or downtrend lines may foreshadow that the trend is losing strength.
Fibonacci Retracements
After strong trends, price will often retrace a portion of the prior move before potentially continuing in the original direction. Deeper retracement levels like 38.2-50% provide more confirmation areas for trades aligned with the main trend.
Order Flow Analysis
The size and timing of buyer and seller transactions, as represented by volume, help reveal significant periods of accumulation or distribution. These order blocks form basis points that price frequently interacts with going forward.
Strategic Order Entry in price action trading
Traders practicing strategic order entry look for high-probability setups in price action trading. They await the confluence of technical patterns unfolding at key support, resistance, or trendline levels. These types of setups can often foreshadow larger moves or the potential development of trends.
With the setup identified, traders will place pending orders such as limits or stops beyond the relevant technical structures. This allows them to define their intended risk-to-reward parameters for potential entries. Having orders pre-placed in this manner reduces the need to constantly stare at charts waiting for an entry. Traders then wait for confirmation signals like a candle or bar closes in the intended direction of the pending order. They also look for volume spikes that may coincide with these signals, as increased volume can validate entries by confirming participation from larger institutions.
However, traders must be careful not to chase every small break of a structure prematurely. It is prudent to wait for confirmation patterns like engulfing candles before entering, to avoid taking whipsaw trades on temporary “fakeouts” that quickly reverse direction.
Money Management
Risk Per Trade: Use 1-2% of account per trade max to survive drawdowns. Take several partial profits to lock In gains.
- Risk: Reward Ratio: Aim ≥1:1 on each trade. Structures provide profit targets while stops ensure predefined loss limits.
- Position Sizing: Increase trade size as the account grows with experience and proven strategy. Scale back when strategies falter to maintain consistent risk levels.
Candlestick Patterns Every Trader Should Know
Common candlestick patterns provide early clues to changing market sentiments that price action traders can identify.
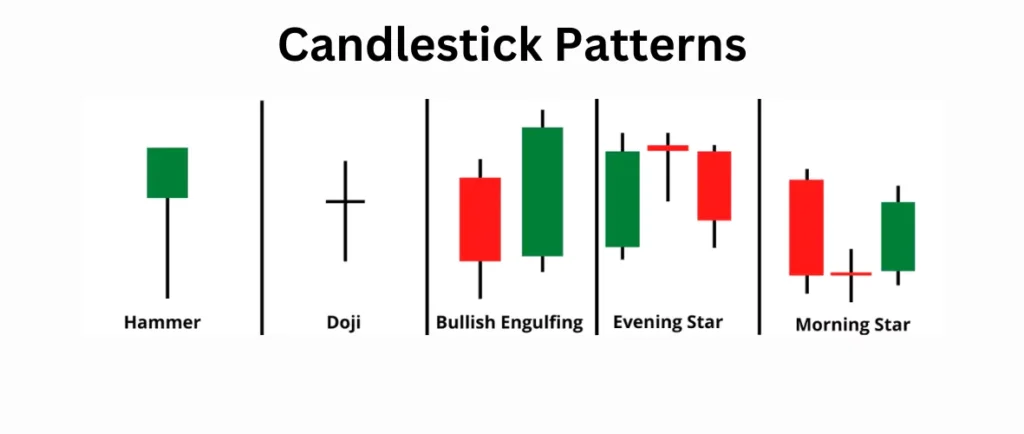
- Pin Bar – A single bar with a small real body and long shadow in a direction opposite to the current trend indicating potential reversal.
- Doji – A candle with little to no real body suggesting indecision between buyers and sellers leading to rangebound markets or potential reversals.
- Hammer – With a small lower shadow and no/minimal upper shadow, hammers form at support indicating buying interest and a bounce may follow.
- Engulfing – A bullish candle fully engulfs a previous bearish candle or vice versa signaling a shift in control and continuation of the new direction.
- Morning/Evening Star – A three candlestick reversal pattern where a long candle is surrounded by two shorter candles of the opposite direction hinting at trend changes.
Identifying Trends in Price Action
Trends defined by higher highs and higher lows (uptrend) or lower highs and lows (downtrend) drive the market over time. Price action traders identify:
- Swing Highs/Lows: By connecting these with trendlines, the path of least resistance becomes clear. Breaks foreshadow reversals.
- Inside/Outside Bars: Bars with small real bodies contained within the prior bar signal continuation. Those extending beyond the previous range indicate momentum shifts.
- Gaps: Unfilled spaces between price ranges suggest strong buying/selling and foreshadow the direction of the next leg. Often act as support/resistance.
- Order Blocks: Areas of heavy activity form barriers that later find value as high probability reversal/continuation zones strengthening with retests.
Range Trading Strategies

During periods of market consolidation, volatility will often contract signaling opportunities for range trading strategies. As prices move between support and resistance levels, successful traders will identify when these levels have changed. For example, a pullback from a prior resistance level could indicate it has now become new support within the trading range. Another approach is to use time-based re-entries after waiting for some time since a previous signal failed.
This prevents chasing short-term moves. Crossovers of moving averages can also provide confirmation signals for breakouts. When prices accelerate beyond what had been a stuck trading range, moving average crosses like the 20-period can validate that the breakout is valid. Volume profile analysis further helps traders identify value areas where there was heavy trading activity during the range. These areas of demand or supply signaled by volume can denote likely support or resistance if prices return toward them.
Conclusion
Mastering price action is an art entailing discernment of subtle market psychology through key clues including candlestick formations, chart patterns, and order flow. Successful traders focus on high-probability setups at proven volatility areas, managing risk for enduring drawdowns. With practice, a feel for ebbs and flows will strengthen entries into the path of least resistance over time. Price action affords flexible responses to evolving environments from any device worldwide.