
Technical analysis looks for trends in past price data that can shed light on how the market will behave in the future. Rectangles are one type of recurrent pattern that can be identified by their unique sideways consolidation phases preceding a breakout. We’ll look at how to use rectangle patterns in breakout trading methods in a variety of markets in this thorough article.
What Are Rectangle Chart Patterns?
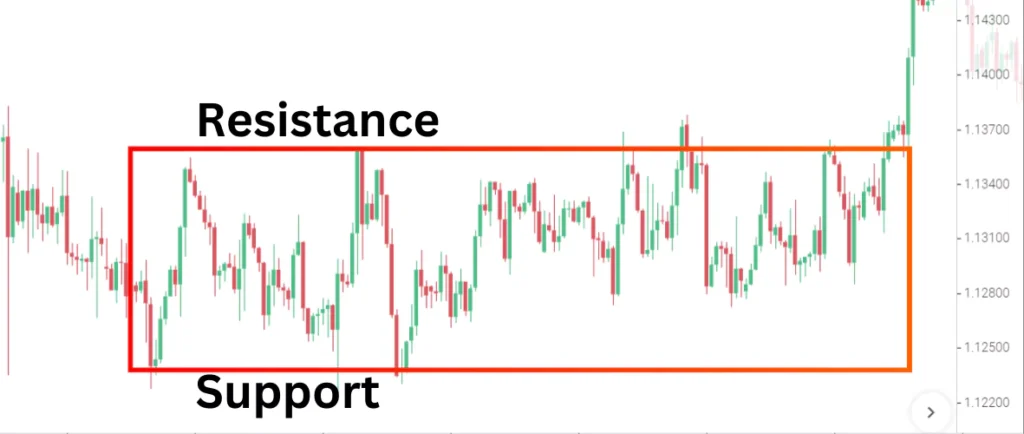
When an asset’s price swings horizontally within a predetermined range over an extended period, rectangle patterns are created. Each of the upper and lower limits must be touched numerous times inside the region, resulting in weeks or months of convergence. These times are characterized by uncertainty as buyers and sellers struggle for control until one side eventually overpowers the other. The direction of the subsequent breakout indicates that a new trend has probably begun.
How Do Rectangle Chart Patterns Form Validly?
A rectangle chart patterns need to meet a few validation requirements to be recognized as one. To demonstrate support and resistance, patterns should have at least three to four touches on each border side. Choppy structures or single tests do not qualify it, but steep angle price changes into the range do. Volume should confirm buildup before the move by dropping off upon entry and showing a discernible increase upon breakout. Valid formations are seen in timeframes ranging from weeks to quarters, which produce high probability trade opportunities on the rule-based boundary break.
What Are Common Rectangle Variations?
Different shaded rectangles appear based on the vertical price differential and time spent consolidating:
- Symmetrical rectangles contain prices ranging equally above and below a central point.
- Ascending rectangles form with the lower boundary rising over time which bulls often overwhelm.
- Descending rectangles involve falling resistance leading bears to eventually puncture support.
Identifying the nuanced variations helps anticipate likely breakout directions or gauge underlying market tensions developing during the period.
How Can Breakouts Be Traded?
To capitalize on the high odds of continuing momentum triggered by rectangle pattern breakouts, traders can employ several strategic approaches:
- Enter long on a close above resistance with a stop under the lows targeting the height of the range.
- Go short below support with an above-resistance stop, aiming for an equal target.
- Set buy limit orders inside patterns anticipating spikes upon breakout.
- Utilize options to benefit from volatility increases like long calls above resistance.
- Trade breakouts via leveraged ETFs that magnify responsive moves.
Hold positions in the direction of the break until momentum subsides for optimal rewards from the powerful post-breakout trend resumptions.
What Indicators Can Confirm Signals?
Combining rectangle identification with supportive indicators strengthens the validity of emerging breakout signals. Potential confirmation factors include:
- Momentum readings like the RSI breaking above/below 30-70 levels at breakpoints.
- Volume increased noticeably above average on the initial candle outside the range.
- Moving average crossovers resonate once bounding lines are pierced.
- Engulfing or large black/white candlestick patterns puncturing limits.
Waiting for confirmation filters out many false ranges while improving trade characteristics. Multiple confirmations maximize the potential for follow-through.
How Can Traders Mitigate Risks?

While rectangle chart patterns statistically favor breakout directions, uncertainty remains. Some best practices to protect positions are to use tight stops under support/over resistance to avoid prolonged whipsaws. Limit trade sizing to 2-3% portfolio allocations for each pattern. Diversify by trading several rectangles simultaneously across assets. Demarcate alternate resistance/support break points in case reversals occur.
Also, be prepared to abandon positions that lack follow-through or retest bounds. With risk management prioritized, traders optimize rectangle trading to endure short-lived whipsaws and benefit from the bulk of high-probability cases.
How Do Supply and Demand Factor In?
Rectangle formations by their very nature show tugs-of-war between interests that are being bought and sold and become unsettled within ranges. Skilled traders keep an eye out for additional cues such as:
- Waning trade volume on retests implies weakening counter-trend liquidity.
- Engulfing candlestick patterns signal one side overwhelming the other.
- Rising lower shadows show buyers absorbing dips; falling upper shadows and vice versa.
- News, sentiment, or catalysts may impact which force ultimately prevails at resolution.
Gauging where demand or supply predominantly concentrates helps anticipate rectangles’ final “decider” breakout more confidently based on underlying supply/demand dynamics.
How Can Traders Filter For Quality Setups?

Rectangle chart patterns are not always marketable. Clever traders concentrate on forms that have optimal qualifications, such as ranges that have endured testing over a range of time and from many perspectives. Whipsaw risk is reduced by tighter price bands with strong support and resistance. The higher statistical expectation is associated with average post-breakout range continuation. Developing in generally trending, steady situations as opposed to extremely erratic sideways markets. Pertinent periods, ranging from weekly to monthly, during which institutions are more involved.
Selectivity guarantees that, in situations where risk outweighs possible gain, convoluted structures with ambiguous resolves are avoided and the highest probability configurations are followed.
Conclusion | Rectangle Chart Patterns
Rectangle chart patterns have statistically valid breakout features over a wide range of markets and instruments, making them reliable chances for technical traders. Breakout trade viability is strengthened by an insightful understanding of underlying supply and demand signals and confirmation behaviors. Rectangle formations continue to fuel profitable tactics that take advantage of the momentum created by resolving price uncertainty when rules-based identification, prudent risk management procedures, and selective filtering are followed. Their persistent ubiquity ensures that breakthrough-oriented techniques will continue to be relevant.