One of the most effective tools in technical analysis is the Moving Average Convergence Divergence (MACD) indicator. It helps you identify trends, changes in momentum, and possible entry and exit points, making it similar to having a GPS for trading. However, it functions best when used correctly, just like any other tool. I’ll go over some of the best MACD strategies in this post so you can advance your career.
Whatever your level of experience, understanding these strategies can offer you a significant edge over your competitors. Let’s begin, then!
What Is the MACD Indicator?
For those who might not know, let’s quickly go over what the MACD indicator is before getting into the strategies. The MACD line and the signal line are two moving averages that make up the trend-following momentum indicator known as the MACD. These two lines give indications of changes in price momentum as they converge, diverge, and cross over one another.
The 9-day EMA of the MACD line is the signal line, and the MACD line itself is the difference between the 12-day and 26-day exponential moving averages (EMAs). A possible trading opportunity may be indicated when these two lines cross.
#1- The Basic Crossover
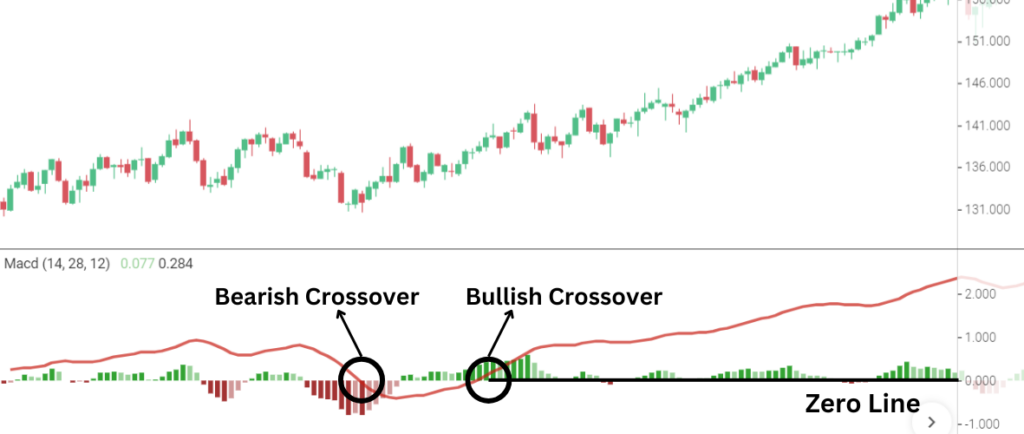
One of the most popular and straightforward MACD strategies is the basic crossover. This occurs when the MACD line crosses the signal line.
How It Works
- Bullish Signal: When the MACD line crosses above the signal line, it’s a signal that momentum is shifting up, potentially indicating a buying opportunity.
- Bearish Signal: When the MACD line crosses below the signal line, it suggests that momentum is weakening, signaling a potential sell or short opportunity.
When to Use It
In trending markets, where prices are continuously rising or falling, this strategy performs well. It enables you to ride the trend by helping you spot the change in momentum early.
Quick Tip
Many traders wait for the crossover to happen above or below the zero line, which is the MACD centerline, to avoid misleading signals. More bullishness is indicated by a crossover above the zero line, while more bearishness is shown by a crossover below the zero line.
#2- Zero Line Cross

The zero-line cross strategy signals a shift in the trend’s direction when the MACD line crosses over the zero line. After a crossover has taken place, this is frequently interpreted as a confirmation signal.
How It Works
- Bullish Signal: When the MACD line crosses above the zero line, it indicates that the short-term momentum is stronger than the long-term momentum, often signaling an uptrend.
- Bearish Signal: Conversely, when the MACD line crosses below the zero line, it suggests that the short-term momentum is weaker, indicating a downtrend.
Why It Works
For traders who want to avoid the noise of smaller fluctuations, this method is perfect because it offers a clearer confirmation of a trend change.
Example
Assume that a buy is indicated by the MACD line crossing over the signal line. You can enter the trade with greater confidence if this also occurs above the zero line, which is a double indication that the bullish momentum is strong.
#3- MACD Divergence

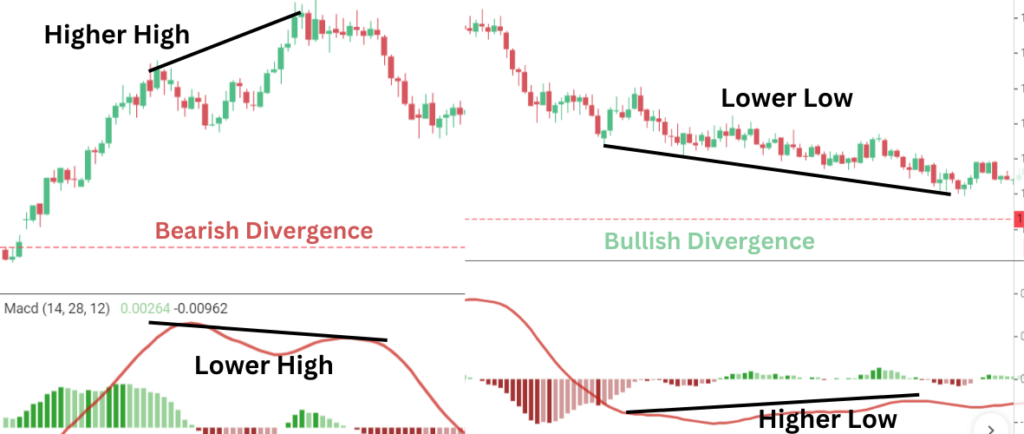
Divergence is an excellent MACD strategies for anticipating possible reversals. When the price is moving in one direction while the MACD is moving in another, this is known as a divergence.
Types of Divergence
- Bullish Divergence: Occurs when the price is making lower lows, but the MACD is making higher lows. This suggests that selling momentum is weakening, and a bullish reversal might be imminent.
- Bearish Divergence: This happens when the price is making higher highs, but the MACD is making lower highs. This signals that buying momentum is fading, and a bearish reversal could be around the corner.
Why Divergence Matters
Divergence resembles a smoke detector. It warns you that a trend reversal may be imminent and that something may be “off” in the market. Divergence by itself does not, however, ensure an instant reversal, therefore patience is crucial.
Pro Tip
To improve your chances of success, combine divergence with other indicators or patterns of price action. For instance, a bullish divergence is a far stronger indication if it coincides with a crucial support level.
#4 MACD Histogram Reversals

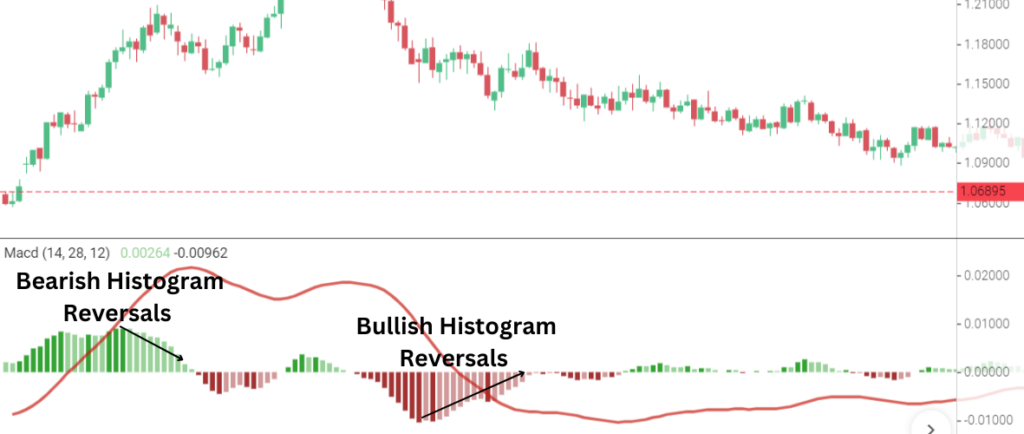
Another effective tool to include in your trading toolbox is the MACD histogram. A common tool for identifying momentum shifts before the lines cross is the histogram, which calculates the separation between the MACD line and the signal line.
How It Works
- Bullish Reversal: When the histogram bars are below the zero line but start to shrink in size (becoming less negative), this indicates that bearish momentum is weakening, and a bullish reversal might be on the horizon.
- Bearish Reversal: If the bars are above the zero line but start to shrink (becoming less positive), it suggests that bullish momentum is fading, signaling a potential bearish reversal.
Why It’s Useful
You may identify possible shifts before the crossover even occurs by using the MACD histogram, which provides a visual depiction of momentum. Entering trades early and exiting before the momentum completely reverses can be facilitated by this.
Example
Imagine that the histogram’s big green bars, which indicate strong bullish momentum, begin to contract. This may be your first indication to consider tightening your stop-loss or selling a long trade, even if the MACD and signal lines haven’t crossed yet.
#5 Combining MACD with RSI

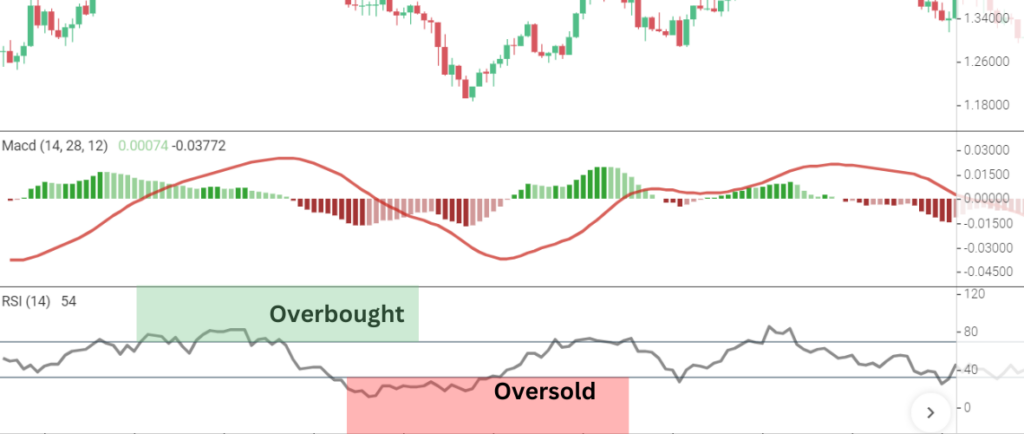
A more comprehensive view of the market can be obtained by combining the MACD with the Relative Strength Index (RSI), even if the MACD is excellent on its own. While the RSI aids in identifying overbought and oversold situations, the MACD tracks changes in momentum.
How It Works
- Bullish Setup: Look for the MACD to cross above the signal line or zero line while the RSI is in oversold territory (below 30). This combination suggests that the market may be ready to reverse upward.
- Bearish Setup: If the MACD crosses below the signal line or zero line while the RSI is in overbought territory (above 70), it indicates that a bearish reversal could be near.
Why It Works
Confirming your signals is made easier by combining these two indicators. The RSI indicates whether the market is overstretched in one direction and needs a correction, whilst the MACD displays momentum.
Example
The MACD has crossed above the signal line, suggesting a possible purchase, as you can see. But according to the RSI, the market is overbought. This implies that it could be wiser to hold off until there is a better entry point because the rising momentum may be losing steam.
Conclusion | MACD Strategies
If applied properly, the best MACD tactics we’ve discussed can revolutionize your trade. Every approach, including the zero line cross, the basic crossover, and the combination of MACD and RSI, provides a different perspective on the direction and momentum of the market. Although the MACD is an effective tool, it works best when combined with other indicators or price action strategies. Additionally, before beginning live trading, make sure to test these methods on a demo account since practice makes perfect.
FAQs
1. How reliable are MACD crossovers?
MACD crossovers are reliable in trending markets but can give false signals in choppy or sideways markets. Always combine MACD with other indicators.
2. What time frame works best for MACD strategies?
The MACD works across various time frames, but it tends to be more accurate on higher time frames like the 4-hour or daily charts.
3. Can MACD be used for scalping?
Yes, MACD can be used for scalping, but it’s often paired with shorter moving averages and faster chart time frames, like the 1-minute or 5-minute chart.
4. What’s the difference between MACD and RSI?
MACD measures momentum and trend strength, while RSI measures overbought and oversold conditions. Combining the two can give a more well-rounded view of the market.
5. Is divergence a strong signal in MACD?
Yes, divergence can be a strong signal, especially when combined with other technical indicators or support and resistance levels. However, it doesn’t always lead to immediate reversals.


